Cisco ASA firewalls have a useful tool for capturing and analyzing the traffic that crosses the firewall, called capture. Sometimes this is also referred to as ‘traffic dump‘ or ‘traffic sniffer‘.
You only need to set two parameters to start capturing:
- indicate the traffic to capture
- indicate an interface on which you want to apply the capture
Step 1. Setting up target traffic
Target packets should be defined with a simple access list. For example, we are interested in capturing traffic from host 192.168.10.100. Create an access list with the following two lines, where the host address serves both as a source and a destination.
You may change ‘any’ in the lines above to a more specific host address or even a network, or change ‘ip‘ to a specific protocol. For instance, to capture TCP traffic between hosts 192.168.10.100 and 1.1.1.1, use commands like these
Attention!
There are no limitations to that access list: it does not filter any traffic, and you may add as many lines as you need. However, the more diverse packets you capture, the harder it is to analyze the results. In the field, you often capture IP traffic (which includes all connections) between two specific hosts.

Step 2. Setting up interface and other parameters
After you identify the traffic to be captured, enable capturing on the interface that is (important!) the closest one to the source. If any traffic specified in the access list passes through this interface, it will be captured and written into a buffer, even if a deny rule is active and traffic will not pass beyond the firewall.
Capture syntax is:
Suppose a Cisco ASA firewall has 2 interfaces:
- dmz is located in network 10.0.0.0 /24, its address is 10.0.0.1
- inside is located in network 192.168.10.0/24, its address is 192.168.10.1
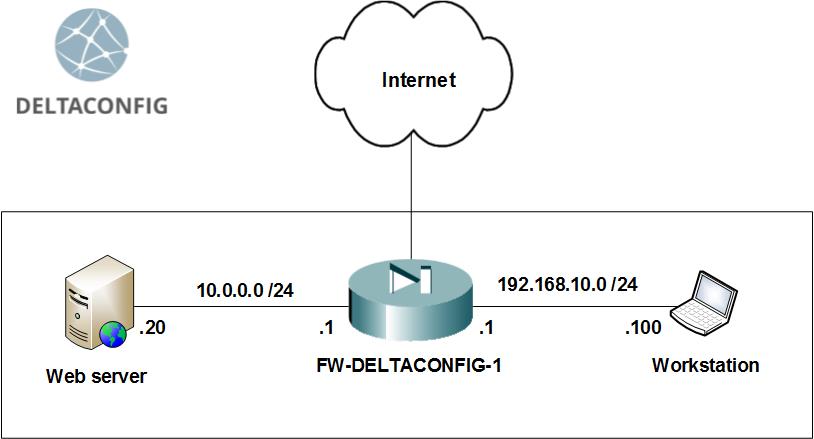
For example, we investigate the case when host 192.168.10.100 cannot reach a web server with ip address 10.0.0.20. To understand the reason behind this, create a relevant access list and enable capture on the inside interface.
Here, capmy is an arbitrary name identifier for a capture, ACL_CAP is an access list specifying the target traffic, inside is an interface on which capture is applied.
After we enabled capture, send an ICMP query (ping) from host 192.168.10.100 to web server 10.0.0.20 and wait until the query is completed. The capture file should now have new lines describing the target traffic.
Step 3. Examining the result
You can look through all enabled captures with sh capture.
You can examine the captured packets with show capture name-of-capture
This output indicates that both ICMP requests from 192.168.10.100 to 10.0.0.20 and ICMP replies from 10.0.0.20 to 192.168.10.100 are able to cross the firewall interface.
Next, from the command prompt at 192.168.10.100 run telnet 10.0.0.20 80 to check if port 80 is reachable by TCP (it’s a web server, after all).
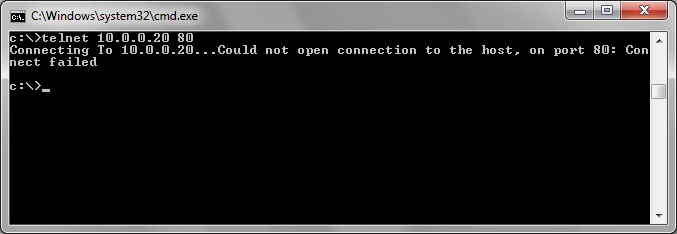
Examining the captured traffic
Three new lines (numbered 9, 10 and 11) are added to the output. Note that traffic is only crossing from 192.168.10.100.62990 to 10.0.0.20.80; no reply packets appear.
Step 4. Analyzing the data
So, ping is working in both directions, but a TCP connection using port 80 (www) cannot be established, since no reply packets are sent. However, the hosts are interconnected (all devices are functional and routing is working fine). We have yet only captured the traffic from one Cisco ASA interface (inside), and we don’t know why the connection cannot be established.
Let’s set up a second capture on dmz interface, which is closer to the destination, to give a complete picture.
Using the same access list, provide another capture name and another interface.
Again, send some traffic from host 192.168.10.100 to port 80 and compare the capture results
The same packets appear on the dmz interface, which is the closest one to the destination address 10.0.0.20. This means that traffic is successfully crossing the firewall, and the issue is at the server which is not responding. It might be that the www service is disabled or a server firewall is active.
Step 5. Clearing the results
You might have noticed that the first capture (the one at the inside interface) lists information on 14 packets, while the second one, which has been enabled later, only lists 3 last packets. To reset the counters and clear the capture results, use clear capture name-of-capture.
Step 6. Saving a capture file
Apart from looking at the capture logs, you might need to analyze them in greater detail by a third-party software like Wireshark or other packet analyzers.
There are many different options to get the file (through ftp, usb, etc.), but the one that is tried and true is a TFTP server. For this:
- set up and launch a TFTP server at any workstation. I recommend using tftpd64, which is simple and user-friendly. For the sake of clarity, we install it at the very same host 192.168.10.100 we used in our examples.
- send some traffic from host 192.168.10.100 to host 10.0.0.20 in order to get some output in both captures: capmy and capmy_dmz. Recall that we’ve cleared their output at step 5.
- check that the packets are captured and written into buffer with sh cap name-of-capture
- upload the file to a TFTP server with copy /pcap capture: tftp:
You’ll have to enter the source capture name, the address of the TFTP server, and the destination filename to save the capture file.
You may now open the file in Wireshark traffic analyzer or send it to a third party for analysis.
Step 7. Setting up advanced options
A capture file by default takes up 512 KBytes in Cisco ASA RAM. If you are capturing more than a couple packets (say, your company daily traffic), the buffer overflows quite soon. You have two options to solve this problem:
- you may set up a non-default buffer size. Add option buffer size to the capture command. A value of 1 000 000 will allocate 1 MByte of memory.
Attention!
Be very wary of your actions, as the device RAM is being allocated. It is strongly recommended not to allocate more than 10 MBytes. After you analyze the traffic, delete the old captures with no cap name-of-capture.
- If you only need a glimpse on the traffic and not going to analyze it in Wireshark and its likes, you can only capture the packet headers. They contain the information on IP addresses, protocols and ports — exactly what sh cap name-of-capture displays. In this case, a standard 512 KBytes buffer will have space for much more traffic. Enable this mode by adding headers-only to the capture command.
You may also make use of circular-buffer parameter, which allows to overwrite the buffer continuously.
You may combine all these parameters in one call.
This article is only giving an overview of capture feature and does not include the subtleties of analysis.
This article was written by Alexey Yurchenko